
Livedemo - IoT
Description
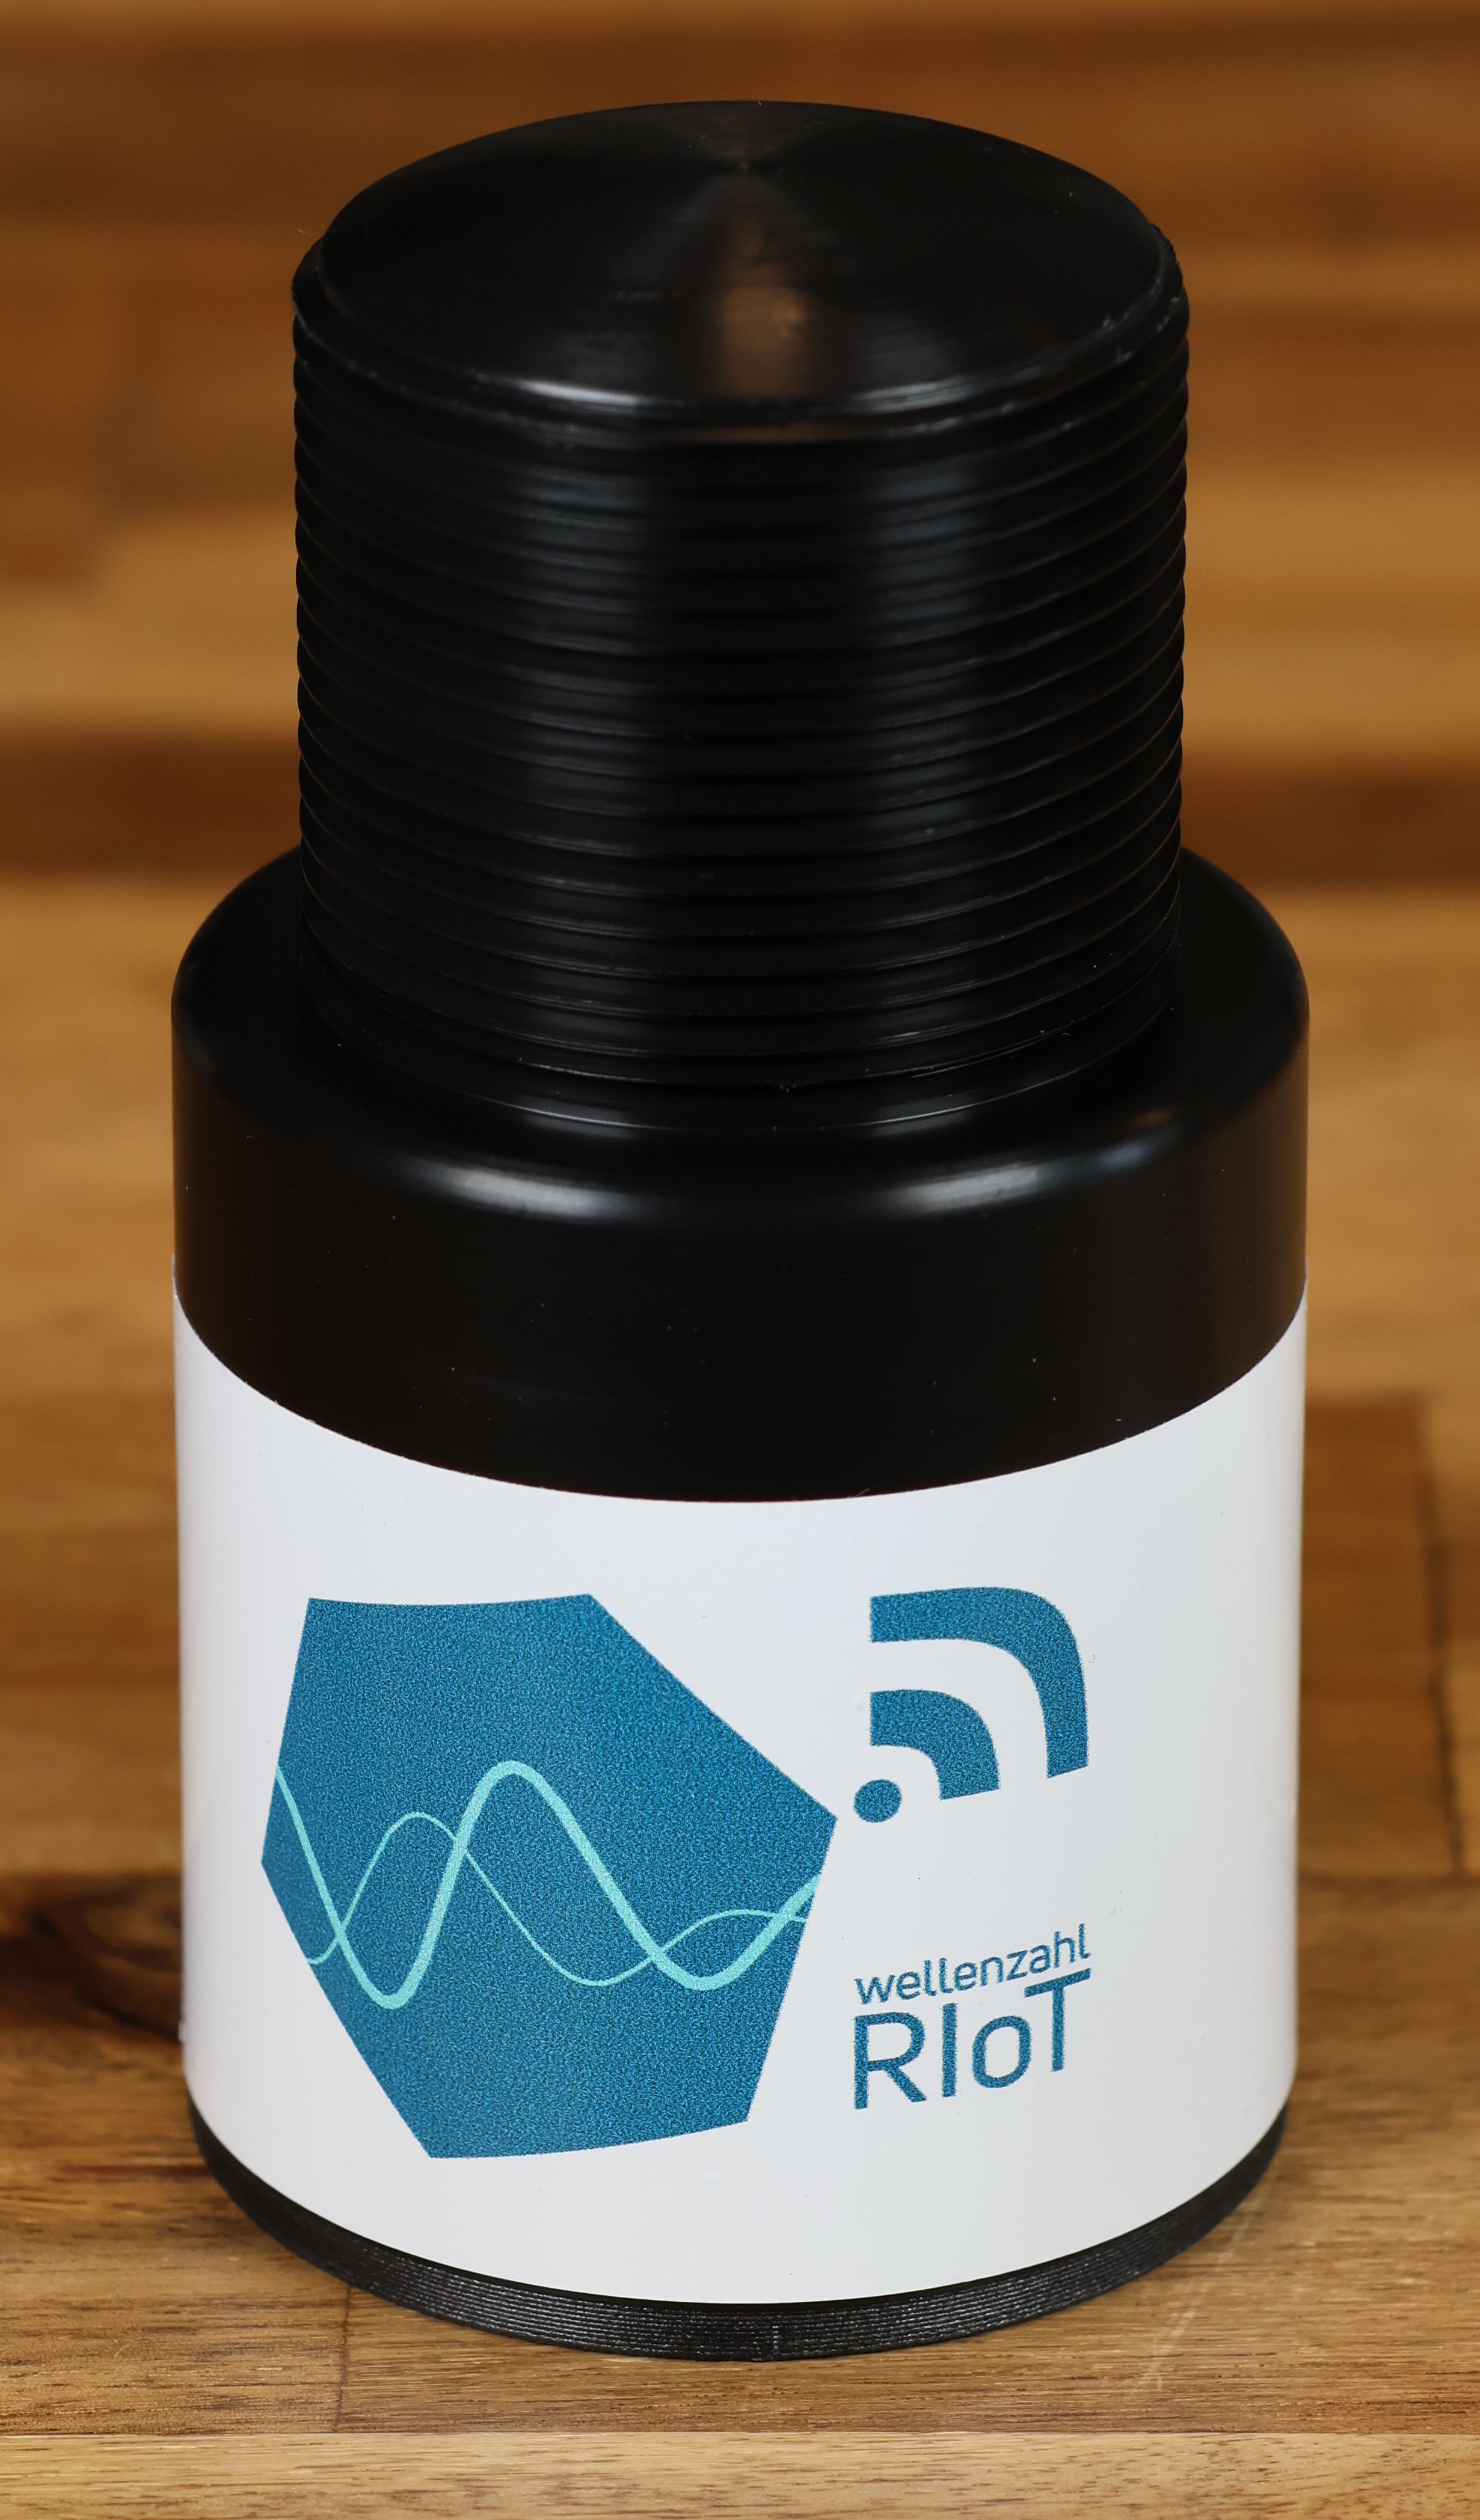
Two of our sensors are currently showcased in different possible applications, transmitting their data via LTE-M to a SQL-Database, where it is visualized on a Grafana Dashboard. The transmitted data includes:
Target list: distances to the three strongest targets in the current measurement, ordered by magnitude (Targets 1-3)
Current error code
Supply voltage
RIoT 1 is powered by two AAA-Batteries and placed loosely around the office. It performs hourly measurements, visualizing all three targets on the dashboard.
RIoT 3 is mounted over a glass container filled with water and connected to a stationary power supply, measuring the distance to the surface every two minutes. This container serves as the secondary tank in the Levelsense demo, allowing the water level to be adjusted via the pump controller. To show different visualization options the measured distance gets taken to calculate the containers filling level.
- A Grafana based GUI is used to show the outputs of the sensor

