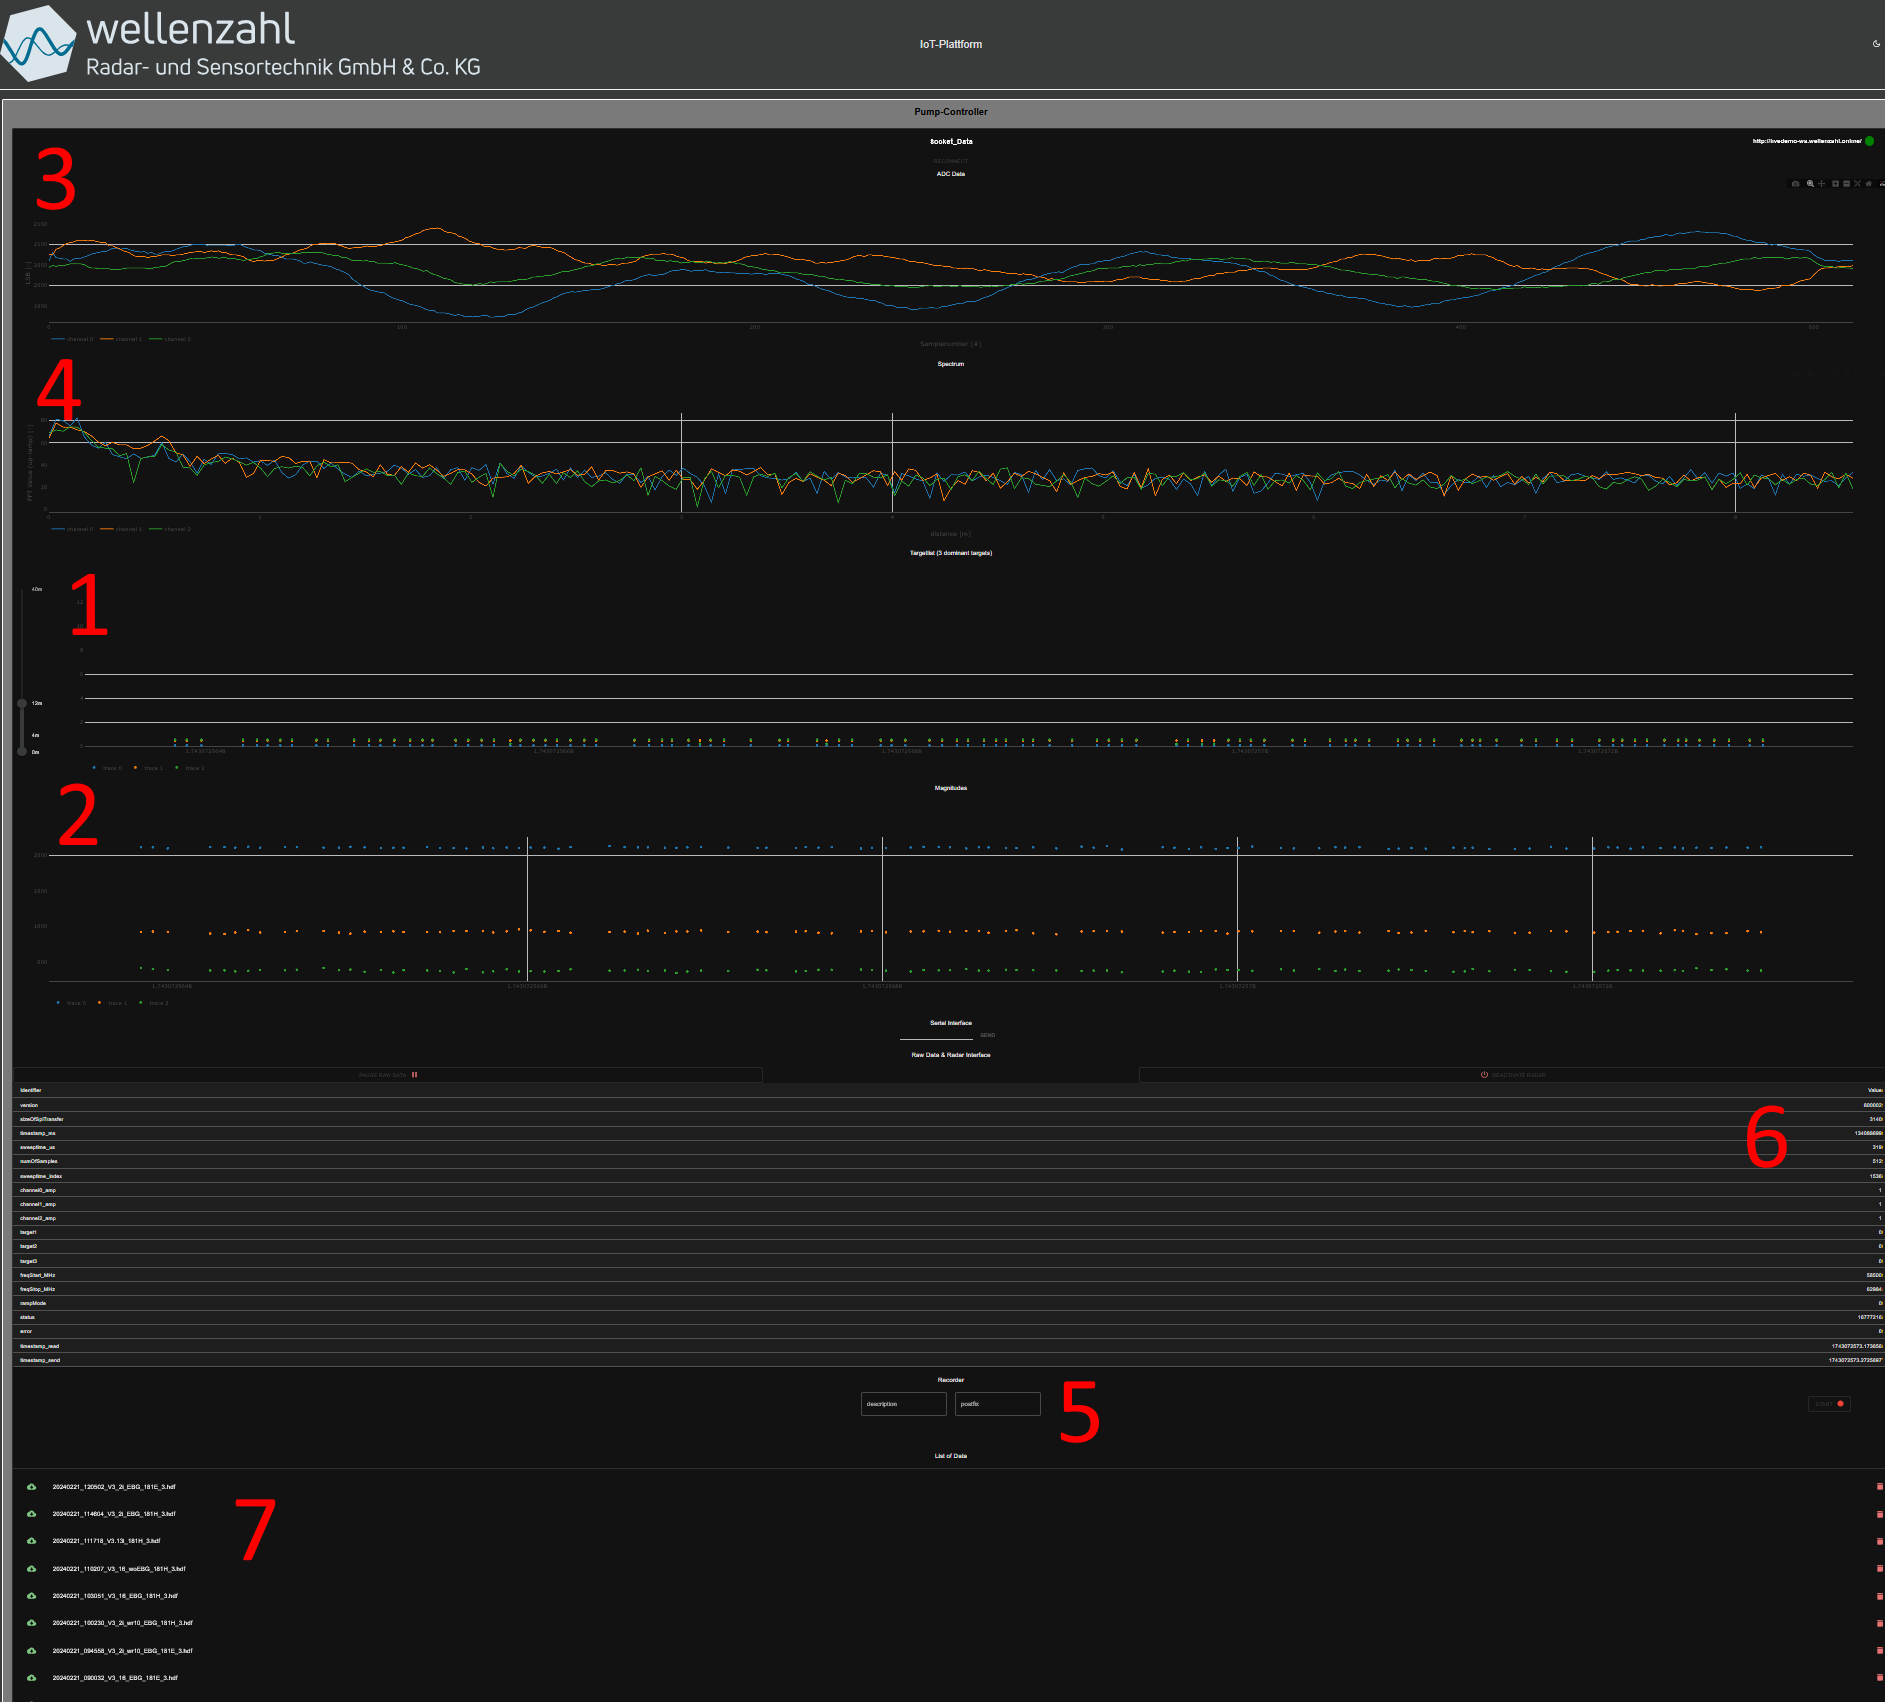
The Web GUI is used for interfacing the radar module. A brief decription of the different sections is liseted in following table:
| Section | Description |
1 | - Time series of three dominant targets
- The targets are evaluated in the Wellenzahl Raspberry Pi backend software
- A zoom FFT is used for the peak detection
- With the left sliders the peak detection window can be set in meter
|
2 | - Shows the magnitude values of the three dominant targets of plot 1
|
3 | - The raw data of the received radar signals
- Depending on the connected module the number of channels is adjusted
- Here: The 60 GHz module has 3 Rx antennas without I/Q information --> 3 curves
|
4 | - The coarse spectrum (without zoom FFT) is shown for each radar Rx channel of plot 3
|
5 | - Command field for setting radar parameters
|
6 | - Switch radar on/off
- Showing radar parameters
|
7 | - Storing raw data and targets in HDF5 format
|

